#1Long & short
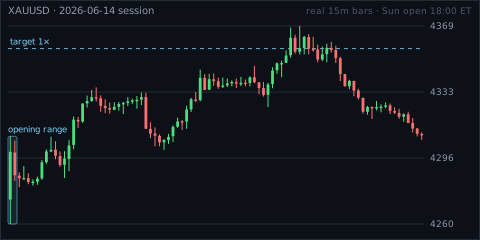
Opening Range Breakout
84–90% reach the 1× target
Trade the break of the first 30 minutes after the 6pm ET open — target one range, stop at the far side.
XAUUSDEURUSDGBPUSDUSDJPYEURJPYUSDCHFBTCETH
Generate the free script Real patterns, counted over eight years on gold, five FX pairs, Bitcoin and Ether — each tile badged with the exact markets where the edge held up.
84–90% reach the 1× target
Trade the break of the first 30 minutes after the 6pm ET open — target one range, stop at the far side.
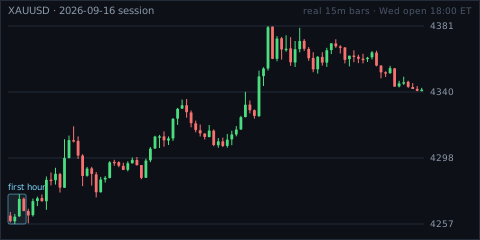
97–99% close in the break direction
When the first hour breaks only one side of its range, the session almost always closes the same way.
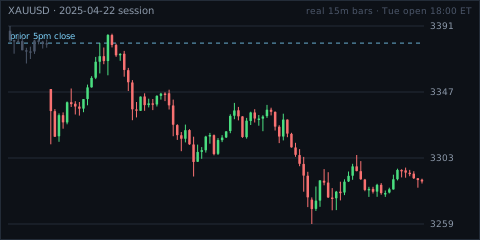
Small gaps fill 84–98% of the time
Gold's 5pm→6pm reopen gap usually goes straight back to where it closed.
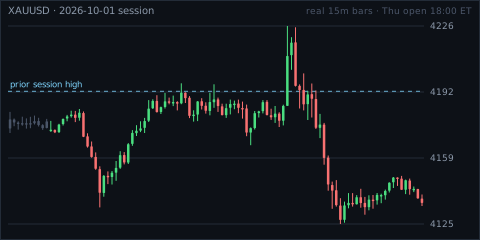
57–61% close red after the failed break
Price pokes above yesterday's high but can't hold it — sell the close back below the level.
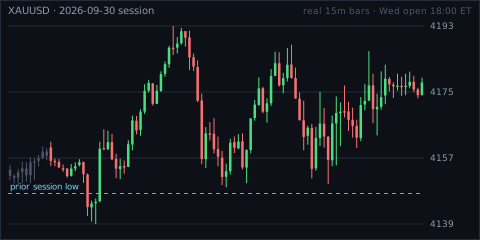
58.1% gold · 54.7% BTC · 53.9% ETH
Stops below yesterday's low get swept, price reclaims the level — buy the reclaim.
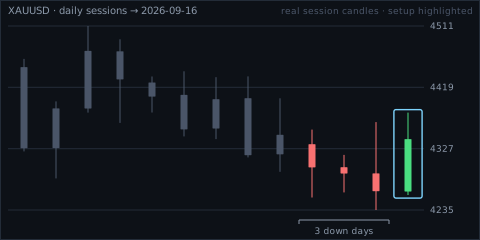
59.0% gold · 59.1% USDJPY · 55.6% BTC · 56.2% ETH
After three down sessions, buy the next open and exit at that session's close.
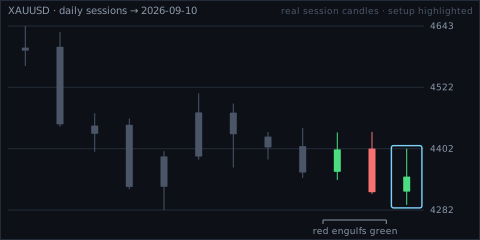
59.7% close green the next day
After a red session engulfs the prior green session, buy the next open and exit at the close.
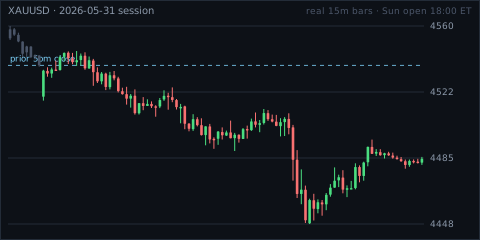
85–90% fill by Monday close
Fade Sunday's reopen gap toward Friday's close, stop at 1.5× ATR.
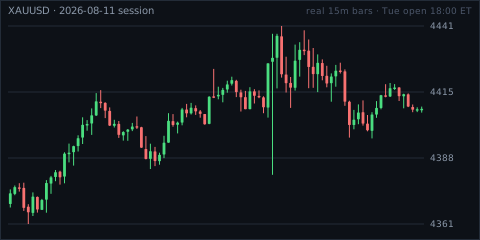
CPI days: 61.2% green gold · 57.5% EUR · 55.1% GBP
Buy the 6pm open on US CPI, FOMC and NFP days, exit at the session close.
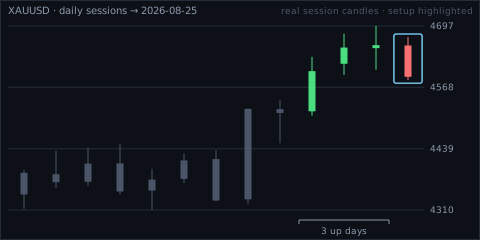
55.7% close red after 3+ green sessions
After three up sessions, sell the next open and exit at that session's close.
Create a free DarkSignum account and the partner portal unlocks the MT5 Expert Advisor and the TradingView script for every strategy above. Paper-trade them on live prices first and watch the real-time hit rate in your dashboard — before you risk a dollar.